TABLE OF CONTENTS:
- Query Form:
- Datasets and Tracks Description:
- Color Codes Description:
- CRE-Region Description
- Usage Example: DDIT4 Gene
- SNPs Example Queries:
top
Here you can find a brief description of the input form. It is basically divided into four distinct panels: "Genomic Locus", "Master SNP", "Cell lines" and "Variation". Question mark buttons all over the form, even the panel section headers, provide the user with short descriptions about each of the input fields on hovering those question marks with the mouse pointer. Those help items are depicted as
The below image defines the letter codes that link each input field from the web form to the corresponding descriptions available on the following tutorial subsections :
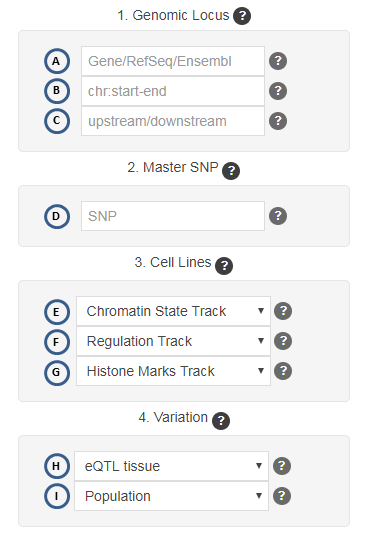
The first panel handles the input coordinates and thus it will define the start and end positions where the analysis will be performed. This length comes from either the coordinates stored for the genes or the genomic coordinates themselves. Genic coordinates are stored based on identifiers, either set as Gene symbols, RefSeq IDs, or Ensembl IDs. Moreover, the final length considered for the dowsntream analyses is computed by adding the flanking-region lengths to the selected genomic locus. However, due to speed and transfer limitations, the maximum length that can be defined anywhere on the form is 350kbp.
The form can take standard gene names (Gene Symbol) and gene identifiers from RefSeq and Ensembl.
The general format for gene names is the following:
Gene -> Official Gene Symbol (not aliases)
RefSeq -> NM_nnnnnn
Ensembl -> ENSGnnnnnnn.
As already mentioned, searches can be performed by genomic coordinates as well, taking into account that user provides valid coordinates from GRCh37/hg19 human genome assembly. We remind that the maximum length allowed is 350kbp, due to speed and transfer limitations.
The coordinates must conform the following pattern: chr{A}:{start}-{end}
For instance, here we select the segment between position 79,349,683 and 82,346,281 of chromosome 4: chr4:79349683-82346281
Last input field of the panel allows user to change the size of the flanking regions. Those flanks correspond to a genomic segment upstream/downstream the selected genomic loci (either if you provide a gene name or genomic coords). Just consider that the limit is 20kbp, both upstream and dowstream.
User can provide two positive integer values, both greater than 0 and separated by the slash symbol, as shown here: {upstream}/{downstream} (i.e. 3/5).
The first number redefines the upstream region (this depends on gene strand), while the second provides the downstream region length. when user provides coordinates or master SNP only, not gene names or identifiers, the strand defaults to forward ("+"). When gene names or identifiers are provided by user, then the corresponding genomic annotation strand is retrieved along with the start and end coords. When this field is set to 0/0, the program will add a minimum of 1kbp to both ends, upstream and downstream, just to ensure proper spacing on the final drawings.
The Master SNP corresponds to a SNP for which the user already knows whether it has functional annotated evidences or that has been found statistically significant from another experiment. By providing this SNP the user can get additional linkage disequilibrium (LD) information with respect to all the SNPs mapped over the genomic region appearing on the final genomic selected region. Such LD is computed for each single SNP on that region and the master SNP. That way the user can also get additional SNP candidates that are linked to the one provided as master; this can assist in the design of further downstream experiments. In the results table, both HTML or PDF versions, this master SNP will be prefixed by "**".
There are two types of analyses that can be done with a master SNP:
A) Search a gene/RefSeq/Ensembl or by coordinates, together with this SNP. It is important to mention that the user must know that the given SNP is within the coordinates given for the genomic location.
B) The master SNP itself, by leaving the coordinates and gene fields empty. By default, the web tool adds then 2kbp to the SNP genomic position, both upstream and downstream. Moreover, a flanking region can be also summed up to those new coordinates. Again, in order to define another flanking length, gene and genomic locus form fields must remain empty, otherwise the program will consider that SNP was part of the genic locus instead of an independent feature.
By default, if no cell line is selected on the corresponding panel of the input form, the search is made over all cell lines, and those falling inside the genomic segment selected will considered and drawn. On the opposite, if only one cell line is selected, the marks present in the given genomic locus will be drawn as one thick ribbon, in fact representing only marks relevant for that cell line (see DDIT4 example results). In the form, those cell lines lacking annotated features for that marks track are highlighted in italics and a gray color, to make the cell lines present in each track more readable. Multiple cell lines selection (default) has the advantage that the resulting figure can give visual clues about the chromatin state at the region of the selected SNPs, for instance.
This track will filter data for cell lines having information regarding histone marks relevant to chromatin state: inactivation (H3K27me3, H3K9me3), and the oposite effect, activation (open chromatin).
This track will filter data for cell lines for which regulatory information is available, corresponding to promoters, promoter flanking regions, and enhancers.
This track will filter data for cell lines that have information about different histone marks, two of them found "abundant" at promoter sites (H3K9ac, H3K4me3) and the other two at enhancer sites (H3K4me1, H3K27ac).
This form field shows the available tissues for which an eQTLs can be recorded in the database.
Last form field allows user to choose SNPs annotated from different human populations. At this moment those are the populations included in our database:
EUR (European)
AFR (African)
EAS (East Asian)
AMR (Ad Mixed American)
SAS (South Asian).
top
This section describes the resources gathered to build the underlying database behind the web application. It starts with a diagram of the data sources and the workflow of the web app, together with the description of each of the tracks represented in the resulting figures.
The web application integrates information from different databases, as shown in the below chart. Those resources are pre-processed into MySQL tables by Perl scripts. On the web applicaation the information gathered from the users' input form is retrieved by PHP scripts, which use the provided parameters to select and filter out specific data from the local database tables and then store into temporary files to help in the making of the image maps. Finally, those PHP scripts also integrate those images and supplementary files into the different results summaries (PNG, HTML, PDF and ZIP files).
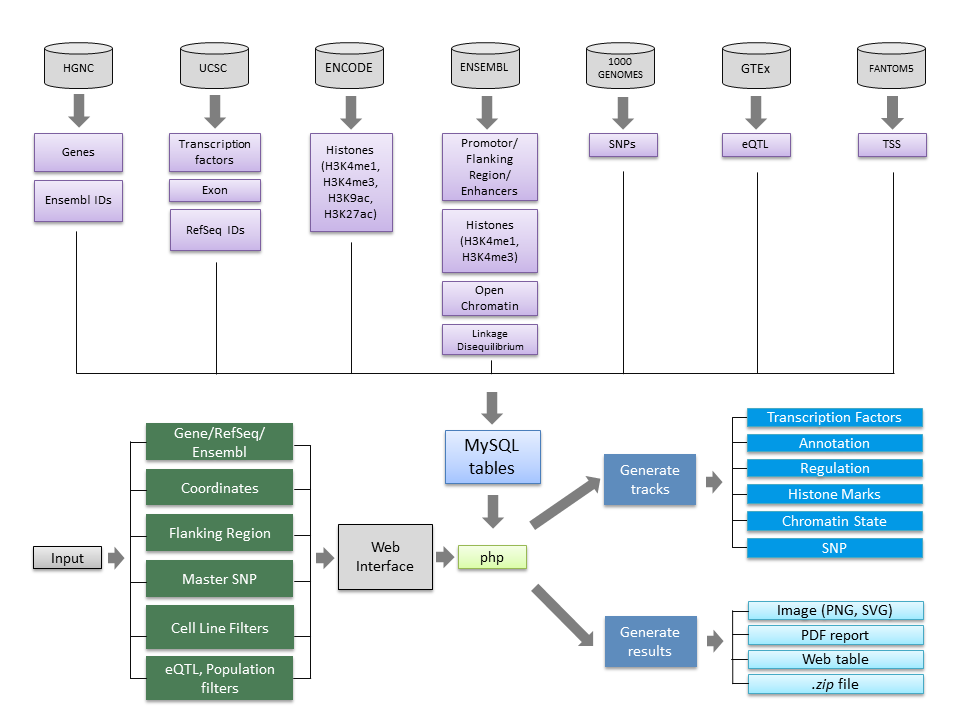
The following table summarizes all the information about the sources of the different marks, binding sites, SNPs, and eQTLs integrated in the web application MySQL database. This includes used database versions and links to the original resources. Some of the links point to a whole folder (like Promoters, Promoter Flanking, ...), because we downloaded the files from that folder. Links to UCSC refer to its "Table Browser" utility, further details of the queries can be found in the corresponding subsections below. The eQTL info is dinamically retrieved from GTEX site; now that site requires that users must register to acces the data, thus we provide the link to a tarball synchronized with this version.
The information was retrieved from the UCSC Table browser utility from the UCSC database. “Regulation group” table of the “TFBS Conserved” and “Txn Fac ChIP V2” tracks were selected. We cover 257 TFs having a total of 9,411,620 binding sites over human genome hg19.
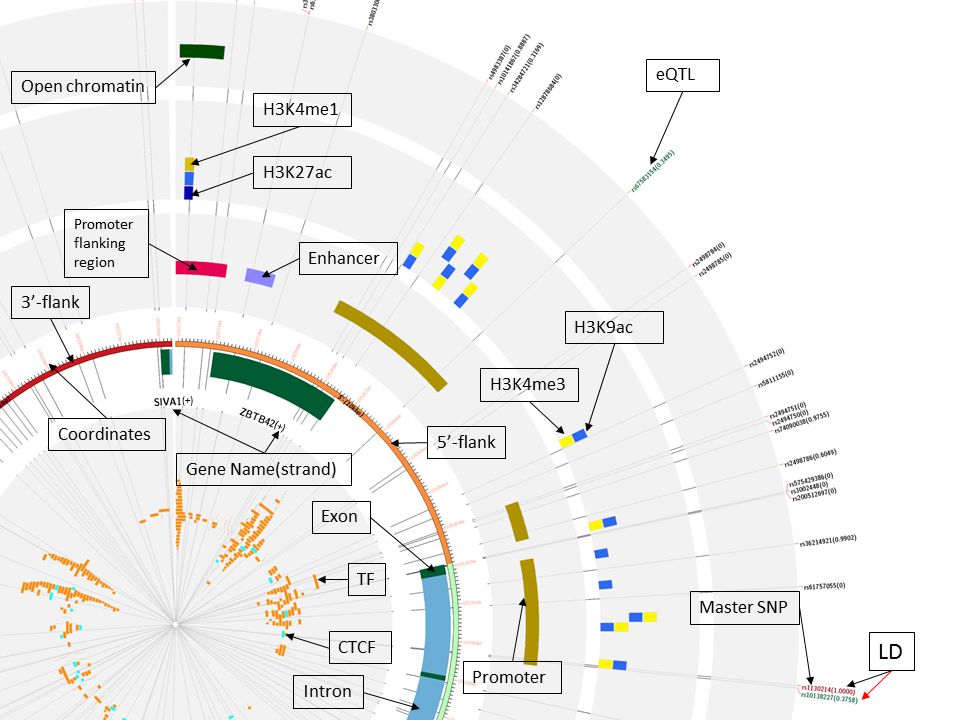
Orange ribbons correspond to TF binding sites on the final plots (see graphical legend), whereas turquoise ones define CTCF-binding sites; overlapping TFBS are remarked as grey ribbons. We thought to highlight CTCF over other TF because it can function as transcriptional activator, repressor, or as insulator protein, blocking in that case the communication between enhancers and promoters. CTCFs can also recruit other transcription factors while bound to chromatin domain limits. The three-dimensional organization of the eukaryotic genome dictates their function, and CTCF serves as one of the core architectural proteins that help to establish this organization. The mapping of CTCF-binding sites in diverse species has revealed that the genome is covered with CTCF-binding sites.
Next table shows each TF and the number of binding sites over the genome that are annotated for it.
Light green ribbons represent the length of genomic locus defined by the user on the first panel of the web form; the query segment is defined by a pair of coords delimiting the gene (from its standard gene symbol, RefSeq or Ensembl identifiers) or the coordinates provided by the user. Orange and red ribbons refer to the 5'–flanking and 3'–flanking respectively. Blue ribbons represent a gene identified inside the input query (if exons are defined in the gene structure then this is the fill color for introns). Finally, dark green boxes inside the gene span represent exons. Gene names and Ensembl identifiers were retrieved from HGNC. Exon information and RefSeq identifiers were retrieved from UCSC Table Browser, from the “Genes and Gene Predictions” table of the “RefSeq Genes” track. We include genic structure annotations for 18,918 gene loci.
Data was retrieved from Ensembl Regulatory Database, release 84. Pink ribbons show promoter flanking regions, light purple ones depict enhancers, and beige ribbons correspond to promoters. We have included 100,483 promoter flanking regions sites, 140,349 enhancer sites, and 20,954 promoter sites.
Epigenetics data was downloaded from ENCODE. Different histone marks were mapped in order to show which modifications could reaffirm the promoter and enhancer sites mapped from the Ensembl database as functional. The histone modifications track includes: H3K9ac and H3K4me3, both correlated with promoter regions; and H3K4me1 and H3K27ac, both correlated with enhancer sites. Briefly, the H3K27ac summarizes 1,126,338 sites; H3K4me1, 1,516,873; H3K4me3, 420,127; and H3K9ac, 1,270,829 sites.
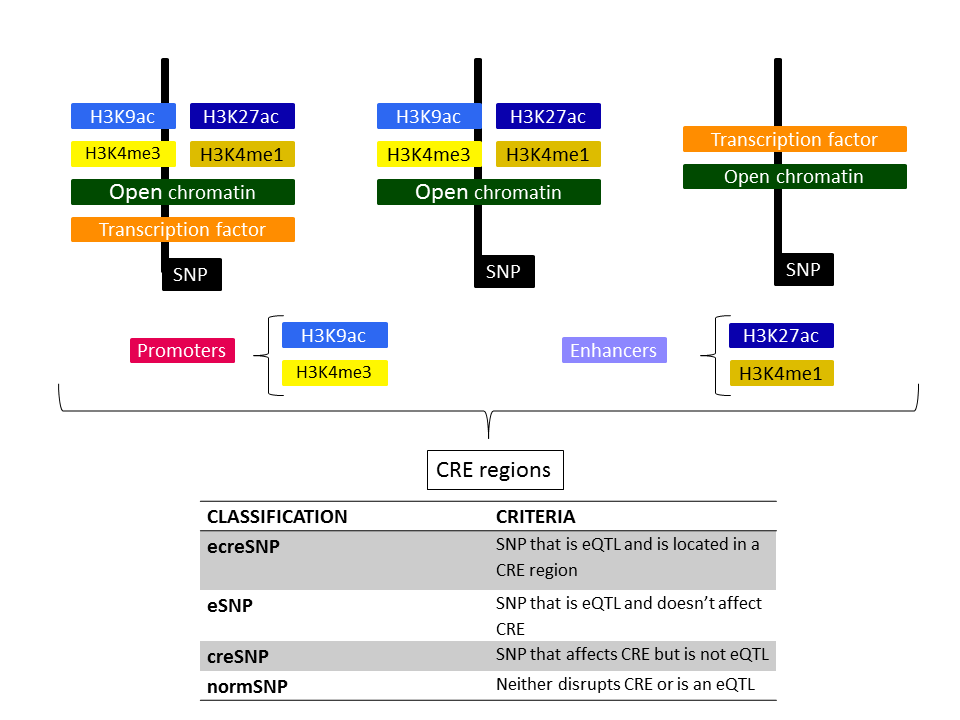
The post-translational histone modifications, H3K27ac and H3K4me1 are found to be representative of active enhancers. When they are both found in the same region and simultaneously in that region there is a mark for an enhancer, this can be considered as an evidence for that region to be transcriptionally active. Moreover, if a SNP disrupts both histone marks and the enhancer, this is a strong indicator that this SNP could affect the normal functioning of such a region. The same can be said about the H3K9ac/H3K4me3 pair, yet they are representative of active promoters. The number of blue and yellow marks represents the number of cell lines having those marks. By default, when no cell line is selected on the input form, then the search is made over all cell lines, and those having the mark will be drawn. On the opposite, if only one cell line is selected, if the mark is present in the given loci then it will be drawn as one thicker band, in fact representing only that cell. By setting the default web form parameter to search in all cell lines, the corresponding blue and yellow ribbons can provide a hint on the relative abundance of those marks. Again, filtering by cell line in the histone track will end up showing the marks that the cell line has and the corresponding ribbons will be thicker just to facilitate its visualization.
Data was obtained from Ensembl. In this track "open chromatin" feature is highlighted in dark green, H3K27me3 in purple, and H3K9me3 in light blue. The latter histone mark is related to heterochromatin yet it contains much less marks annotated; whilst the former is related to inactivation signals of the chromatin. Thus, we have considered appropriate to combine them in the same track. In sumary, there are 938,294 open chromatin sites, 3,236,553 H3K27me3 sites, and 11,882 H3K9me3 sites uploaded in our database.
Data was retrieved from the 1000GENOMES project. The track shows the SNPs that were mapped onto the genomic coordinates, mainly providing their location and dbSNP identifier. If a “master SNP” was provided in the initial form, the SNP label also contains the computed linkage disequilibrium (LD), the values are always shown within parentheses after the SNP identifier. Those cases without LD will show a "0" symbol inside the parentheses following the SNP identifier. SNPs remarked in green are also eQTLs, they are genomic loci that contribute to variation in expression levels of mRNAs. The “master SNP” from the initial form field will be shown in red. The current database covers 9,477,952 SNPs with MAF > 0,1 and 1,984,754 eQTLs.
top
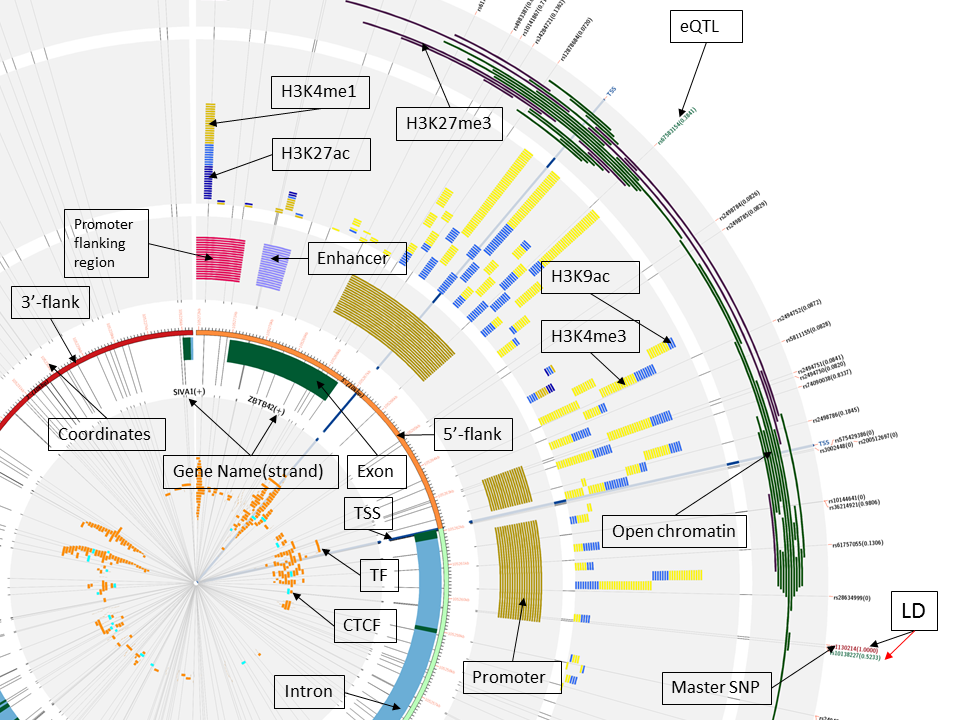
Each genomic feature depicted in the resulting plots has a distinct color assigned to it in order to facilitate its visualization. You can find below the graphical legend where the colors and the relative position of each feature type can be found in the final plots. Furthermore, just a couple of subsections ahead, there is an annotated image that illustrates the placement of each feature in those final plots, taking as example AKT1 gene results.
The graphical legend summarizes the different tracks in the same order they appear in the results figures, starting from the left as the most inner track. For each track, the colors are annotated along with the genomic features represented in the plot. The graphical legend is embed in the HTML and PDF versions of the graphical results produced by this web application.

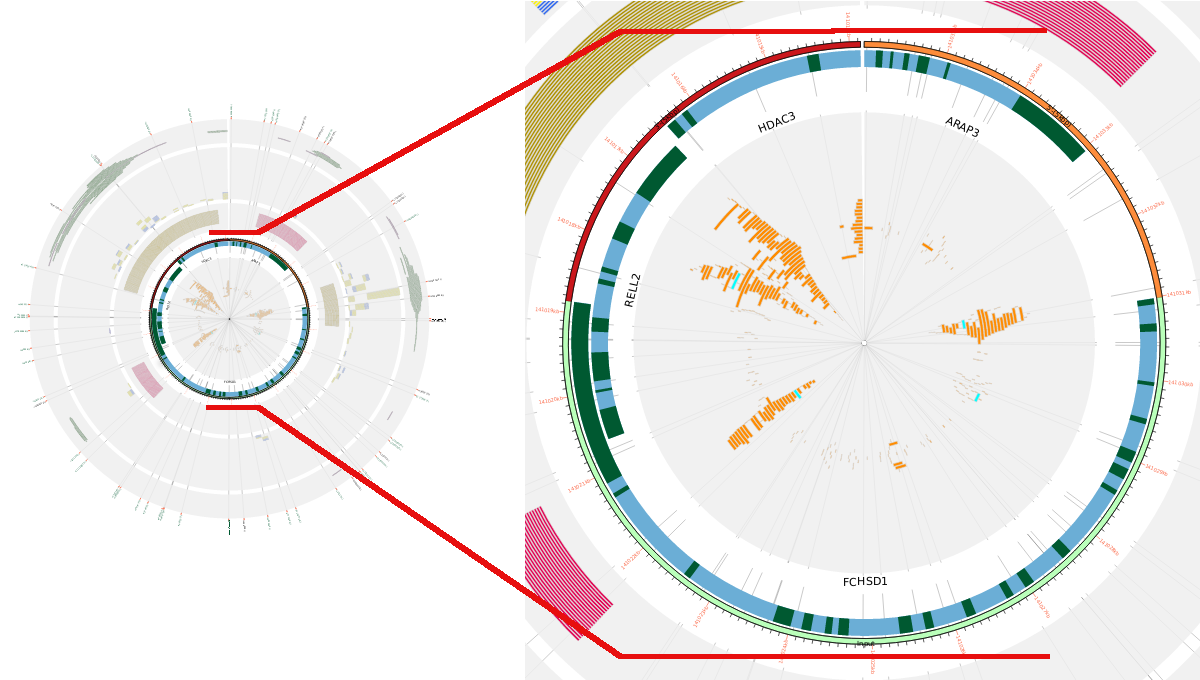
The figure below represents the results obtained after searching the FCHSD1 gene. As it can be seen, there are three additional genes in the query region: RELL2, HDAC3 and ARAP3. Each gene has its exons (dark green) and introns (blue) drawn, and to be able to differentiate between overlapping exon region in this track each overlapping gene will occupy a higher subtrack region (RELL2 in this figure). Those genes that are also in that region, but are not overlapping, will be drrawn in the outermost part of this track (HDAC3, ARAP3 and FCHSD1).
Initial Query:
- Gene: AKT1
- Master SNP: rs1130214
- Flanking: 10/10
- Cells: ALL
- eQTL: ALL
- SNP Population: ALL
Features that can be appreciated in the figure below:
- SNPs line beneath the tracks facilitating the visualization of the SNP's possible relationship/effect on the different structures (in case it disrupts the other features).
- Master SNP is colored red (find it on the lower right corner of the figure).
- eQTLs are colored green and each SNP has in parenthesis its linkage desequilibrium (LD) with the master SNP, or 0 if it does not have LD.
- Genes are colored blue (introns) with dark green as exons on top. The name of the gene includes the strand direction within the parenheses ("+" meaning forward strand, "-" for reverse).
- 3'-flank is shown in red and 5' flank in orange. If the input is a gene name/Ensembl/RefSeq IDs and it is in reverse strand (-), the 5'-flank will always be on the right side of the figure, whilest if it is in the forward strand (+), the 5'-flank will appear on the left side; the selected region (in light green) always fall on the bottom half of the plot (just below the main AKT1 gene in this example). Selected regions from chromosome coordinates and direct SNP queries are set in forward strand and will have the 5'-flank on the left.
- Each 1kbp of the input has an orange tick indicating the current position (GRCh37/hg19).
Note from this figure zoom, that the pair H3K9ac and H3K4me3 are more abundant in promoters-rich regions, and the pair H3K27ac and H3K4me1 in enhancers or promoter-flanking regions (they include enhancers).
In the figure below, we used the same initial query as in the previous case, but we also filtered the Chromatin, Regulation and Histone Tracks by the A549 cell line. We can see that this cell line presents same marks as in the previous figure, but here they are thicker.
top
Internally we distinguish between different CRE region types, as depicted in the figure below. A CRE region can be defined as a feature disrupting histone marks (either the ones correlated with promoters or enhancers), open chromatin and transcription factors, or histone and open chromatin, or transcription factor and open chromatin. The labels assigned and the criteria are also summarized in a table.
top
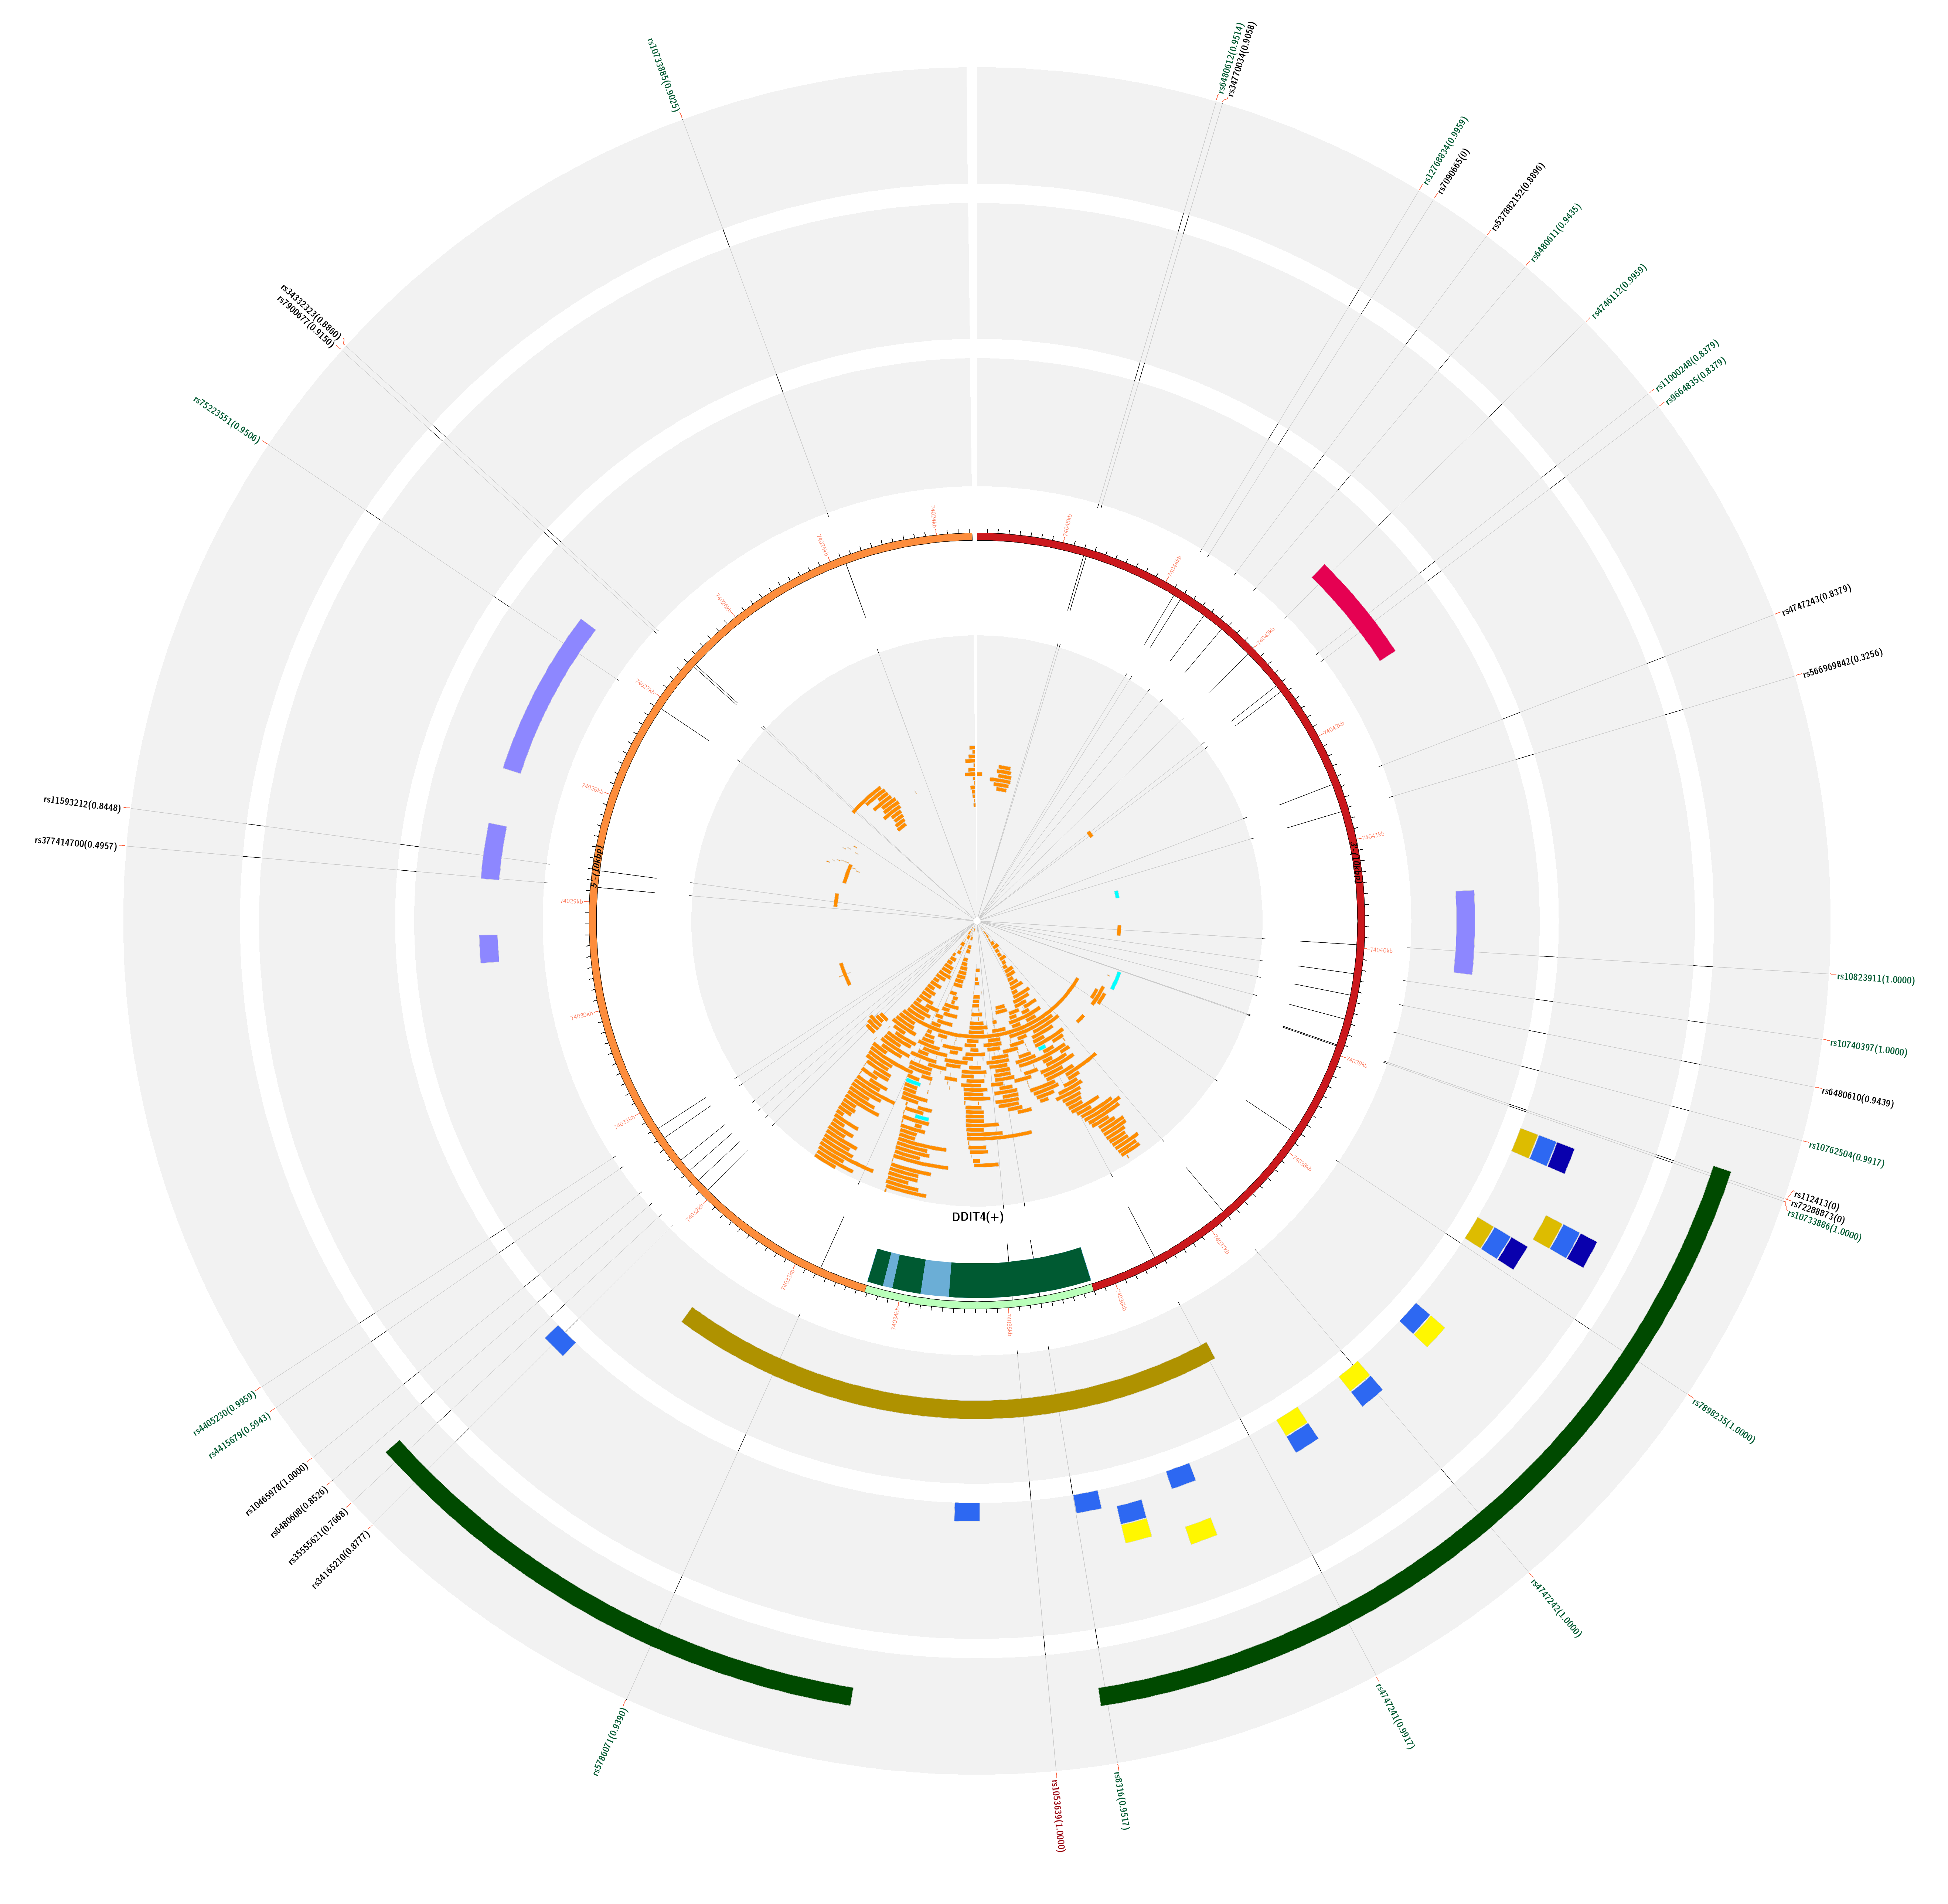
For this use case, we are going to play with gene DDIT4, located in chromosome 10 between 74,033,677-74,035,797bp (GRCh37/hg19). As master SNP we are going to use rs1053639, because in previous experiments we performed it was statistically significant (Mas S et al, 2015). Thus, by providing this SNP we will retrieve the linkage desequilibrium among it and all the other SNPs falling within DDIT4 genomic region.
We searched by gene name (DDIT4), but the form also accepts RefSeq IDs (NM_019058 for our query gene), and Ensembl IDs (ENSG00000168209 in this case).
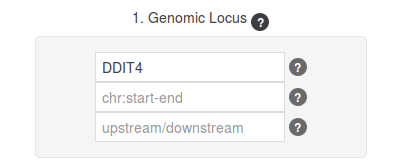
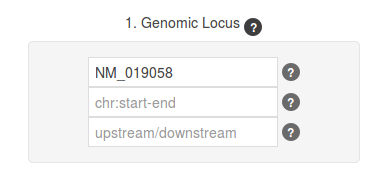
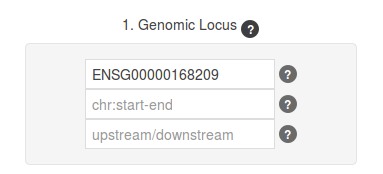
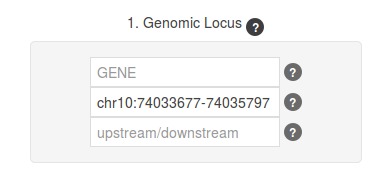
Similar result can be obtained by providing the genomic coordinates of this gene (for this example, this will be chr10:74033677-74035797). Please note that you cannot input a gene identifier (either a symbol, a RefSeq ID or Ensembl ID), simultaneously with a genomic region. It has to be one OR the other. The web application will always assume that the genomic coordinates define the sequence in the forward/positive strand, so that please ensure you provide them in that order.
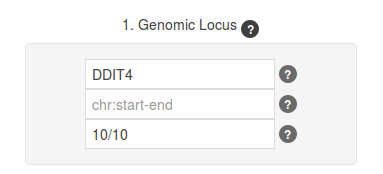
The final step in the Genomic Locus panel can be to define lengths for the flanking sequences. The first number represents the upstream and the second one, the downstream region; for instance 7/5 means it will add 7kb upstream and 5kb downstream to the coordinates of our query genomic region. When retrieving the coordinates from the gene identifier in forward coordinates (start always smaller than end), thus depending on the gene annotated strand the upstream region is located at the starting position of the genomic region (forward genes), or at the end position of that region (reverse genes). We are going to provide for this example 10/10 as the upstream/downstream flanking distances (default are 5/5 kbp).

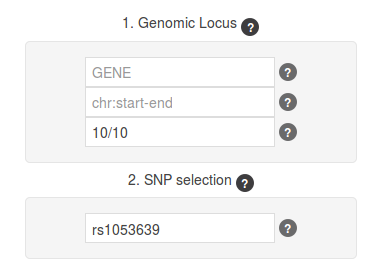
As master SNP we will use rs1053639, because in our previous experiments we found it as statistically significant (Mas S et al, 2015). Represented in the below figures you can find two different ways to provide the query for the same genomic region: "gene + flanking + master SNP" or "genomic coordinates + flanking + master SNP". Both of those two queries will produce same final results.


The web application also permits to input a "solo" master SNP, but then gene and genomic coordinates form fields MUST be empty. By default, given the position of the SNP introduced the application adds 2kb upstream and downstream of it (as the SNPs themselves are defined as a very short genomic segment, a single nucleotide for a nucleotide substitution), plus 5 kb as flanking regions in 5' and 3'. User can customize this too, as it has been shown for gene queries before.
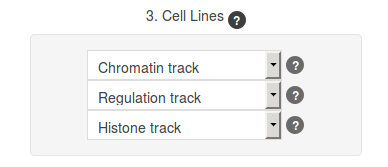
Next step will be to select a cell line of interest for each of the tracks provided in the third panel of the input form (Chromatin State, Regulation, and Histone Marks). On each track, cell lines that are missing are marked in gray color and italic font. For example, the cell line A549 that is present in all tracks will produce as a result a more robust image. Note that if there is no information for a given set of cell lines (or for that genomic segment) the correpsonding tracks will remain empty in the final figure. By default the form will select all the cell lines. This can give the user a broad idea of where the promoter, histone marks, and chromatin features are located. Filtering by a specific cell line then, will give her clues about what features can be relevant for the regulation of the gene in that condition.
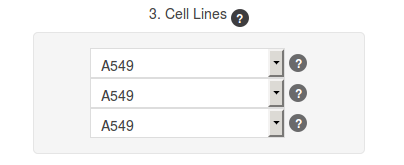
The last panel of the input form allows filtering by eQTL tissue and population. For the current example, we will filter now by Thyroid tissue and EUR population.
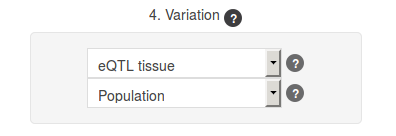
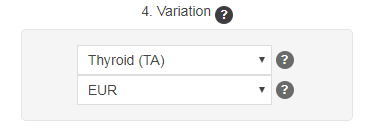
For this guided example, the web application mapped 36 SNPs within the query's coordinates, 20 of which are eQTLs. Furthermore, those can be subclassified in the following types: 5 ecreSNP, 2 creSNP, 15 eSNP, and 14 normSNP.
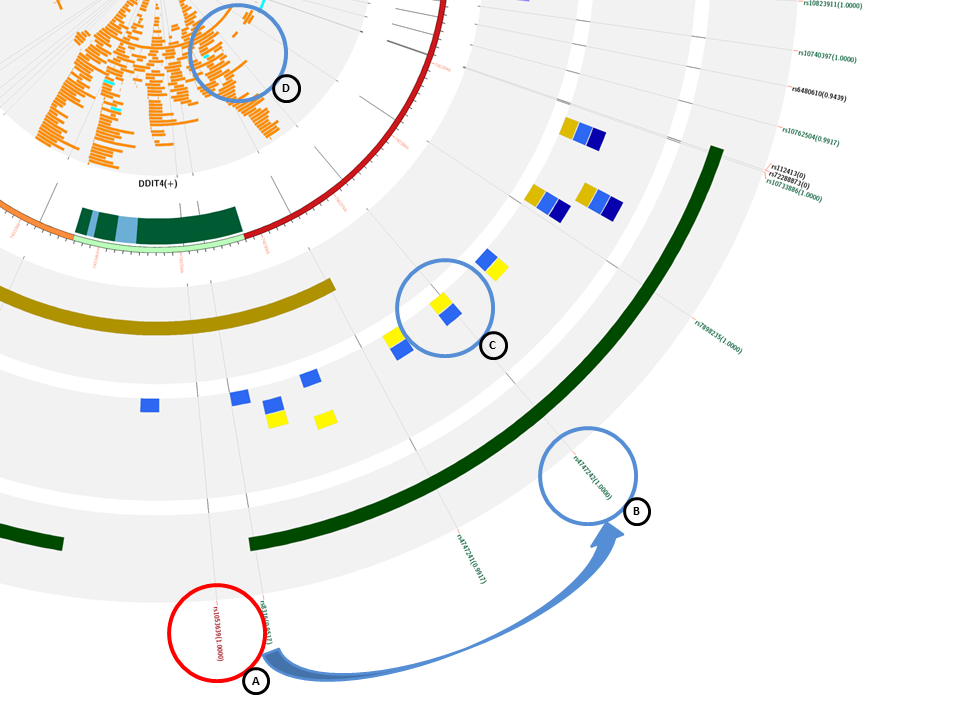
The master SNP is located in the last exon of the gene, inside a promoter mark and in between multiple TF binding sites including YY1 and POLR2A. The former can either activate or repress gene expression and the latter is part of the subunit alpha of the RNA pol II (see labeled circle D highlight on the zoomed image).
If we zoom in, and focus on the master SNP (A) of this analysis, we can see that it has other SNPs with a high LD and most of them are also eQTLs. From those SNPs, rs4747242 (B) could be a new candidate for a functional study. It has high LD with the master SNP, it is an eQTL, disrupts the histone marks associated with promoter marks (C), and also disrupts TFBS of YY1 and POLR2A (D).
top
In this last section, the examples will focus at three SNPs from different genes, looking for clues given from the resulting images and the classification table (either from the HTML or the PDF report versions).
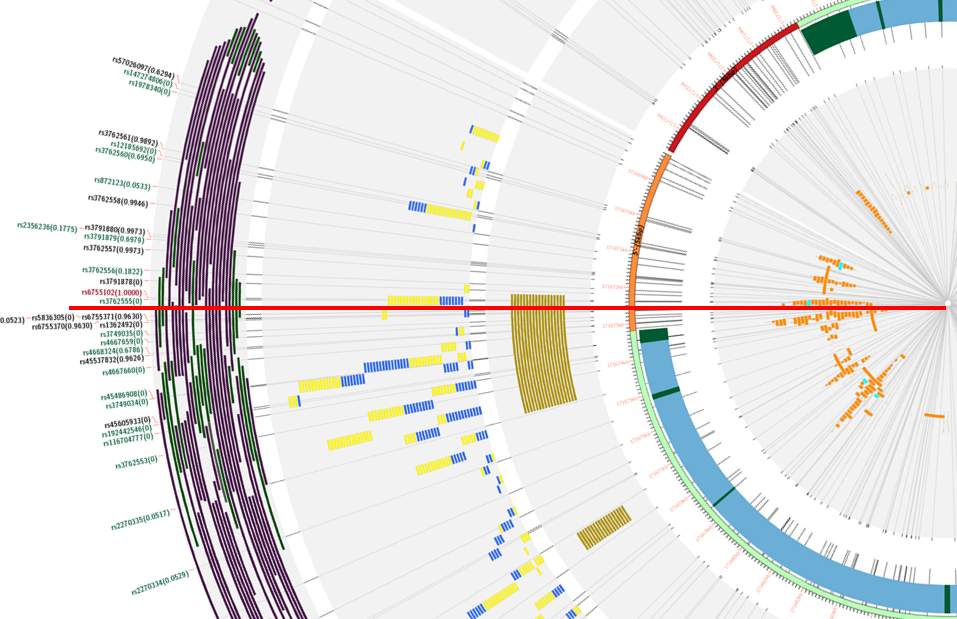
This SNP is located in the 5'-UTR of the GAD1 gene and in an extremely repressed promoter as reported by Mitchell et al, 2015, specially in schizophrenic patients. Moreover, the same repression can be seen in the resulting image, indicated by the dark violet bands in the second to last track.
rs6755102 has also been reported as a functional SNP located in the GAD1 gene by Du et al, 2008, and forming an haplotype with other two SNPs (rs3762556 and rs3791878). The classification table resulting from searching the GAD1 gene and rs6755102 as master SNP, classifies these SNPs as ecreSNP (highest level) for the former and creSNP for the latter.
Finally, SiNoPsis also classifies rs6755102 as creSNP, disrupting both H3K9ac and H3K4me3 (histone marks correlated with promoters), the promoter mark in the Regulation Track, and 20 transcription factors, including POLR2A and CTCF as it can be seen in the figure below highlighted by the red line.
Knowing that rs6755102 is a functional SNP, a researcher can use our web application and get more SNP candidates searching this as master SNP as we did in this query. Based on the results obtained in this query, the next SNPs could be interesting to include in a functional study based on their classification and linkage desequilibrium: rs3762560 (ecreSNP, 0.6950); rs3791875(ecreSNP, 0.7246); rs3791879 (ecreSNP, 0.6979); and rs4668324 (ecreSNP, 0.6786).
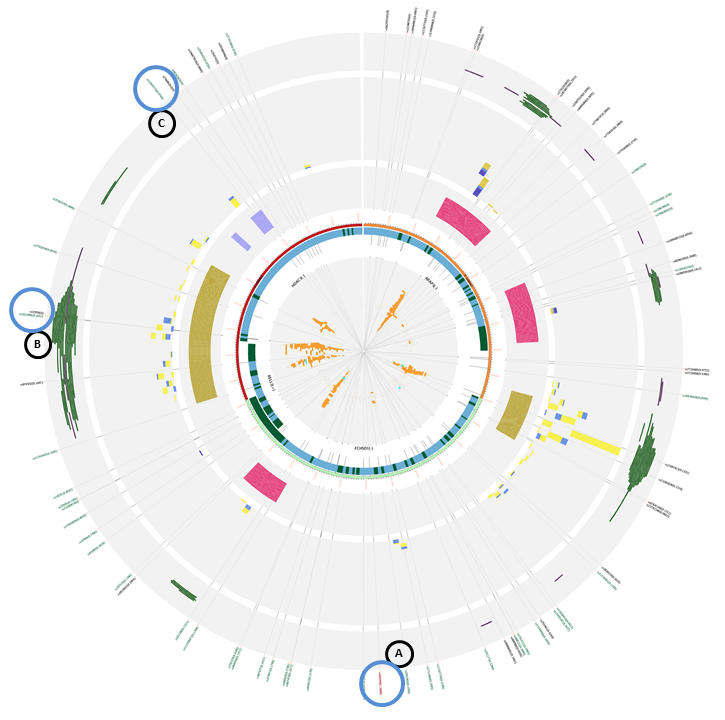
Starting from our previous study of a predictor of extrapyramidal symptoms induced by antipsychotics (Mas et al, 2015), the rs456998 (A in the figure below) variant was found to have strong interaction will others three SNPs from other genes in the same mTOR pathway. To improve the predictor it will need to add more variants or validate the ones found. In order to do that, as a first analysis, one can use SiNoPsis to get ideas of new variants related to the one found. We performed the query with the FCHSD1, 10/10 flanking, and with rs456998 as master SNP.
As it can be seen in the figure below, we get additional clues about two other SNPs:
rs1421896 (B in the figure below) is depicted inside an open chromatin region, promoter mark and histones marks correlated with promoters as well as inside multiple TF binding sites, near he first exon of the HDAC3 gene. Given that has LD with our master SNP, and the gene it could affect has a wide range of effects, it makes us think that maybe the interaction that we discovered from our master SNP could be due to the effects that rs1421896 has on HDAC3 to continue our studies it could be interesting to include it in a next downstream experiment as this SNP could affect the expression of FCHSD1 gene directly of through modification of the HDAC3 gene which indirectly could modify FCHSD1.
rs12655779 (C in the figure below) only disrupts an enhancer region and its an eQTL. This SNP could affect the promoter region of the FCHSD1 gene in two ways, one through 3D remodeling of the chromatin of the enhancer region and another through the eQTL property of the SNP.
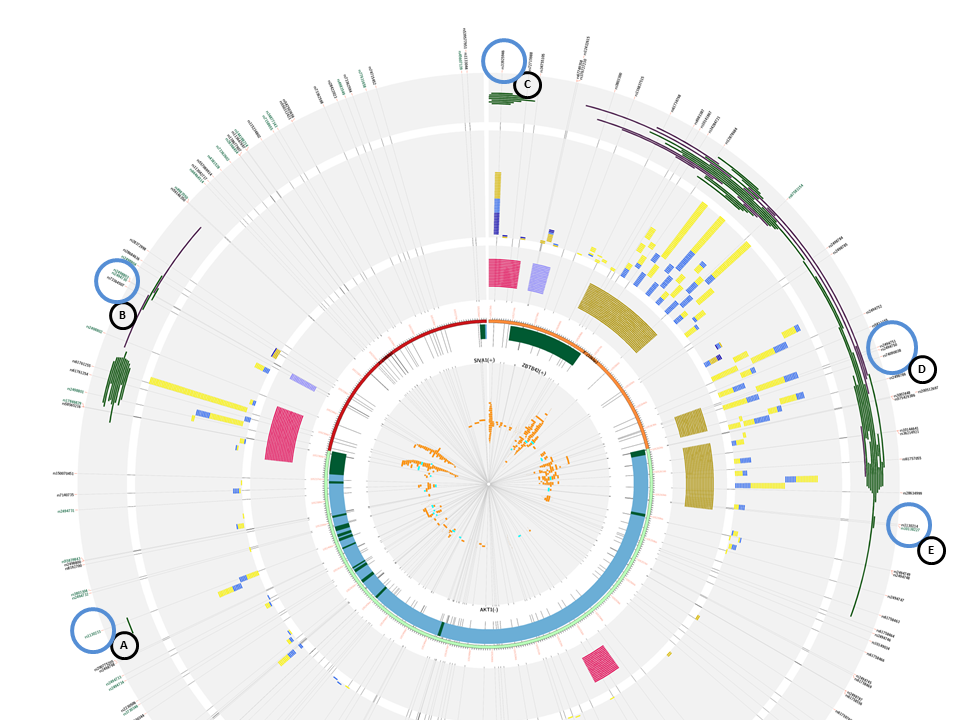
If we find ourselves without a master SNP, because the study is new and there are no functional SNPs studied until now, we could also use the web application to start including possible functional SNPs into experimental study. We introduced the AKT1 gene from the mTOR pathway, with 10/10 flanking regions. At first sight, we can appreciate that there are two more genes in our query that are transcribed from the + strand, unlike AKT1, from the - strand. Also, there are three promoter marks in multiple cells, two of them belonging to AKT1 promoter and one to the ZBTB42 gene.
This is a list with the following SNPs that could be introduced in an experimental study, given that they disrupt the histone marks correlated with promoters and the proper promoter mark plus TFBS and some are eQTLs:
- rs1130233: ecreSNP (A)
- rs74090038: creSNP (D)
- rs2494750: creSNP (D)
- rs10138227: ecreSNP (E)
The following SNPs could be selected based on they position inside histone marks correlated with enhancers and enhancer regions:
- rs73364507: creSNP (B). This SNP is inside an enhancer mark, but it does not disrupt the histone marks, but is 500bp away from said marks.
- rs33925946: creSNP (C). This SNP disrupts the histone marks, and a promoter flanking region, considered to have enhancer regions inside. This could be interesting to see if affects the expression of AKT1, given that it has all the characteristics to be inside an enhancer region.
top