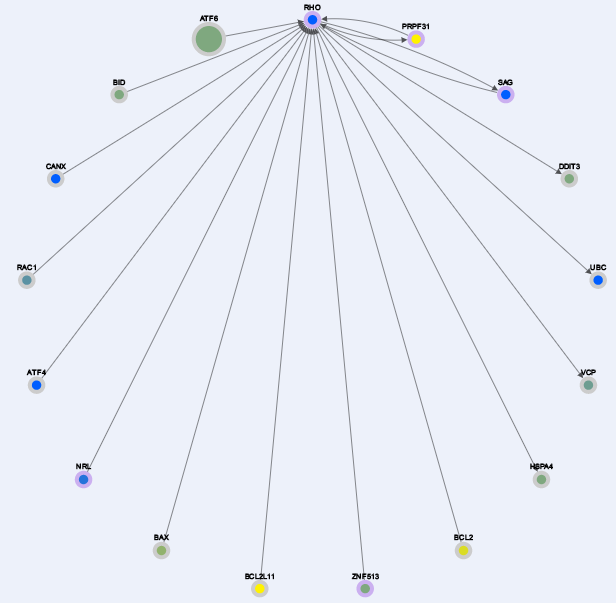
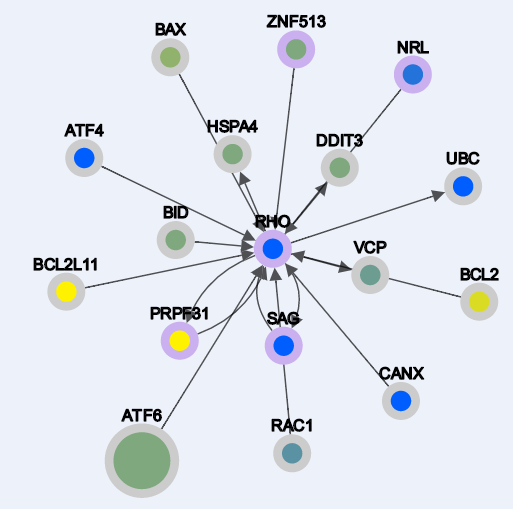
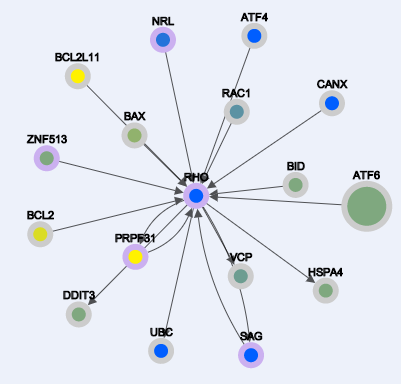
RPGeNet v1.0 Brief Tutorial
Home

- Color Legends
- Exploring the network
- A) Search single or multiple gene
- B) Select nº of neighbouring nodes
- C) Select interaction file (1-4)
- D) Select expression file
- Get path genes
- Navigation options
Border Color Codes

Expression level color codes:
Absolute

Relative

The absolute color code begins from the left as having null expression in retina (dark), increasing in expression level as it goes to the right, until it reaches the most level of expression in retina (darkblue).
The relative color code is based in the z-score of each gene. This z-score goes from -3 to +3, representing with more dark yellow (-3, expressed more in other tissues, but not in retina), white (0) and dark blue (+3, expressed more in retina than the other tissues).

A) Search single or multiple gene
Here is where you can input a gene or multiple of interest related or not with Retinitis Pigmentosa (RP) (althought if is not related there is a big change that it won't have interactors, since the network is using RP genes as seeds). If the input are multiple genes, then those genes have to be separated be a comma "," and a blank space " " between them.
As a search result for the query: "RHO, EYS, PRPF6" you will get the nodes represented in this snapshot below:

Here the border of the nodes are color coded:
orange borders -> the gene has no interaction in our generated networks
purple border -> the gene is an RP gene (used as seed)
gray border -> the gene is found at the level 0 of interaction (explained in the files types).
B) Select nº of neighbouring genes
Here you can specify how many neighbouring genes should each node that interact with the query have. By default is one, and we recommend that for single gene queries this should not be greater than 3, and for multiple genes searches this should not be greater than 2.
C) Select interaction file (1-4)
There are 4 levels of interactions build from the RP gene seeds, with the default file (which represents the level 0 interactions) that is selected if there is no input in this field. Each interaction level is contained in a separate file (having 4 files of interaction). By specifying a number from 1-4 this selects the interaction file to be used to draw the interactions (see node color coding).
D) Select expression file
"Absolute" represents the absolute expression level of each node in the retina (see expression color codes).
"Relative" represents the relative expression levels (in the form of a z-score) of each node in the retina respect the other tissues (liver, adipose, brain, etc ...). By default the "Absolute" expression level is selected.

E) Select RP gene
Select a gene from the drop-down menu (there are 62 genes) that represent the genes used as seeds. This will generate the shortest paths where the selected gene is present.
The shortest paths are also build from the conectivity found between the 62 RP gene seeds. As a search result for FSCN2 gene the paths are represented in this snapshot below:

F) Select interaction file (1-4)
Exacly the same purpose as in the section C)
G) Select expression file
Exacly the same purpose as in the section D)
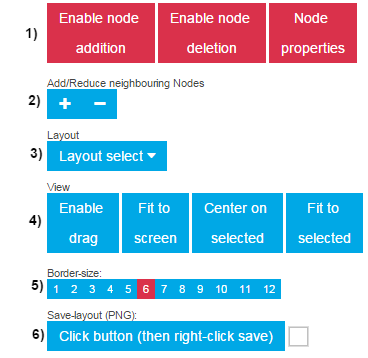
1) Add | Delete | Properties
1. A) Add
By clicking the add button first, node addition will be enabled, and by clicking on any node in the network it will get the interactors of that node and draw them.
Example (query -> RHO):
-Interaction results:

-Enabling Node addition and clicking "BID" node results:

1. B) Delete
By enabling node deletion, first for multiple deletion select all the nodes and then click on any of the selected genes. (!NOTE!: For now the nodes that are deleted cannot be restored, but that could be achived by refreshing the page).
Example (query -> RHO):
-Interaction results:

-Enabling Node deletion and clicking on any selected node:

1. C) Properties
By enabling node properties, for each node when clicked appears a pop-up with gene aliases and useful links to external resources such as: GeneCards, UniProt, OMIM, RefSeq, GO, UCSC and RetNet.
Example (query -> RHO):
-Enabling Node properties and clicking on the "RHO" node:

2) Add/reduce neighbournig nodes
By clicking the plus sign "+" the app will add one layer of neighbouring nodes for each gene in the drawing area. The oposite action will occur if the minus sign "-" is clicked, retrieving one layer. (This is equivalent to search for a gene and specifying in the form that there should be "2" neighbouring nodes. See section B).
Example (query -> FSCN2): left (interactors of FSCN2); right (adding one layer)
3) Layout Select
Different types of layout algorithms.
From left to right: Grid, Random, Circle, Breadthfirst, Cose, Dagre, Cola, Springy, Arbor, Concentric. By default the layout algorithm is "Dagre".
4) View
Here there are 4 different options:
-Enabling drag: upon which the nodes cannot be selected, and the whole drawing area can be "dragged" with the cursor
-Fit to screen: will fit all the nodes in the drawing area to be visible
-Center on selected: will center the view of the screen on the selected node/s
-Fit to selected: will fit to the whole screen just the selected nodes
5) Border size
Values of node border size ranges from 1 to 12, for the purpose of distinguish better the node's color in the center. Left: border 1, Right: border 12.
6) Save layout as PNG
Generates a miniature of the visible drawing area, that can be exported as .png image format (right-click save as local image).


